Steal this Graph (and the data too) (updated 1 Nov 2016)
What’s Happened?
- Since the 1920’s
- Every time Democrats take the presidency, jobs are created faster
- Every time Republicans take over, jobs are created slower
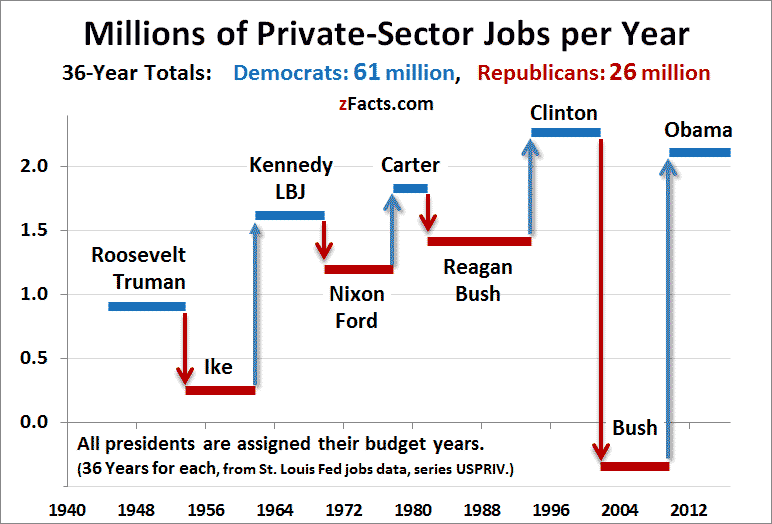
- In the last 72 years, Democratic administrations have created more than twice as many jobs as the Republicans even though both held office for 36 years.
- How did W. Bush dig such a deep hole? Very quickly! Just between Dec 2008 and Jan 2009, when Obama took office he lost 0.8 million — an annual rate of 10 million per year. Think how far down −10 is below the bottom of this graph. Yes, things are better now.
Why?
- The Republicans never want to pass a job stimulus bill — they all voted against Obama’s. (Even conservative economists agree it worked.)
- They would rather let a crucial industry fail in order to teach it a lesson, than save workers’ jobs. For example, they tried to stop the auto bailout, which was a huge success (zFacts).
[social_warfare]
Possible Objections
Republicans just had bad luck. So, I guess, going back to the late 1920s, Herbert Hoover was unlucky, Roosevelt-Truman, lucky, etc for 10 administrations. That’s like every administration flips a coin and heads is more jobs and tails is few jobs. And for 10 out of 10 flips the coin does as I predict — the GOP gets tails and the Dems get heads. The odds of that prediction being right 10 times in a row is (1/2)×(1/2)×… ten times, which is 1 chance in 1024.
But maybe the Republicans are really great job creators, an have just been really really unlucky, and this time their luck will change. You want to bet the American economy on that?
You can’t blame G. W. Bush for the recession Bill Clinton started. I agree. Bush got hit by Bill Clinton’s recession about a month after he took office. No president can turn the economy around on a dime. They have to get Congress to pass a law, and then the bureaucracy has to gear up. So Clinton is responsible for the several months of Bush’s term.
Something like six months or a year seems reasonable. But if I pick the number I think is right, people will say I rigged the system. Luckily there is one natural choice. Clinton’s last budget year officially ended on Sept. 30, 2001. I’m sure that’s not perfect, but it’s better than saying Bush was responsible for February after taking office on 21 January. That’s just crazy.
So I assigned every president responsibility through the end of their last budget year.
Back in the 1940’s the labor market was much small than now. True, so Roosevelt and Truman had a much harder time adding a million jobs than Obama has. But since the parties have taken fairly even turns, the bias this causes is small.
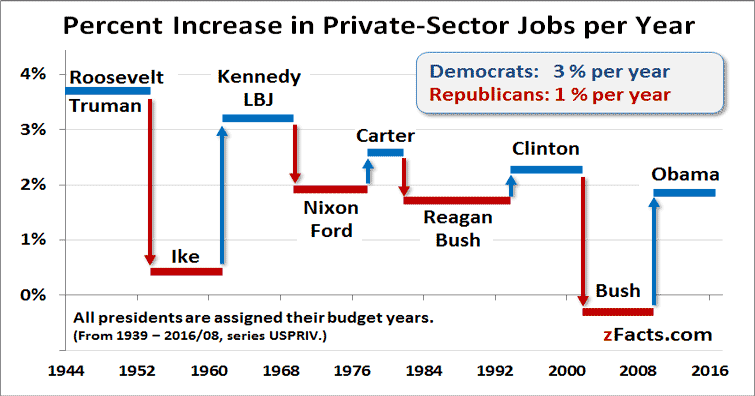
And when you do the math, it turns out the bias is against the Democrats. Here’s what I got when I scaled the job market up every year and calculated jobs as if it had always been as big as it is today.

Now you can see there was a big bias against Roosevelt and Truman in the top graph. So their contributions don’t count for much in the 2 to 1 Democratic win in the top graph. When you give them a fair shake the Democrats win by almost 3 to one.
For more on the above graphs: Job-Creators Background Page

